5.2 Measures of Central Tendency
Measures of central tendency describe the center of a data set using three main statistics: mean, median, and mode.Key Concepts:
-
Mean:
The arithmetic average of a data set, calculated as: \[ \text{Mean} = \frac{\sum x f}{\sum f}, \] where \(x\) represents the class midpoint, and \(f\) is the frequency.\\ In case of grouped data use midpoints of each group to estimate the mean (see Example 2.) -
Median:
The middle value in an ordered data set. Note that the data must be ordered first. \\- For an odd number of values: The median is the middle number. \\ Example: Data = \(1,2,3,4,5\) \\ Median = \(3\).
- For an even number of values: The median is the average of the two middle numbers. \\ Example: Data = \(1,2,3,4,5,6\) \\ Median = \(\frac{3+4}{2} = 3.5\).
-
Mode:
The most frequently occurring value in a dataset. For grouped data, the modal class is the class with the highest frequency.- If a number appears most frequently, it is the mode. \\
Example: Data = \(1,2,2,3,2,4,5,6,4,3,2,3,4,2,3,2,6,5\) \\
Frequency:
- \(1\) appears once.
- \(2\) appears
6
times. - \(3\) appears 5 times.
- \(4\) appears 3 times.
- \(5\) appears 2 times.
- \(6\) appears 2 times.
2
(most frequent value).
- If a number appears most frequently, it is the mode. \\
Example: Data = \(1,2,2,3,2,4,5,6,4,3,2,3,4,2,3,2,6,5\) \\
Frequency:
-
Graph work:
You can find certain measures of central tendency from cumulative frequency graph or histograms. See examples 3 and 4 for details.
Examples:
Example 1: Find the Mean, Median, and Mode of the Given Data Set.
Given Data:
\\ \(12, 7, 10, 15, 10, 18, 12, 10, 14, 7, 16, 12, 10, 9, 10\)Solution:
Step 1: Find the Mode
- Count the frequency of each number:
- \(7\) appears twice.
- \(9\) appears once.
- \(10\) appears
5
times. - \(12\) appears 3 times.
- \(14\) appears once.
- \(15\) appears once.
- \(16\) appears once.
- \(18\) appears once.
- The mode is the number that appears most frequently. \[ \text{Mode} = 10 \]
Step 2: Find the Median
- Arrange the data in ascending order: \[ 7, 7, 9, 10, 10, 10, 10, 10, 12, 12, 12, 14, 15, 16, 18 \]
- Find the middle value. Since there are 15 numbers (odd count), the median is the 8th value. \[ \text{Median} = 10 \]
Step 3: Find the Mean
- Use the mean formula: \[ \text{Mean} = \frac{\sum x}{n} \]
- Calculate the sum of all numbers: \[ 7 + 7 + 9 + 10 + 10 + 10 + 10 + 10 + 12 + 12 + 12 + 14 + 15 + 16 + 18 = 162 \]
- Divide by the total number of values (\(n=15\)):
Example 2: Find the mean from the following frequency distribution.
\begin{tabular}{c|c|c}Class Interval
&Frequency (f)
&Midpoint (x)
\\ \hline 0 - 10 & 4 & 5 \\ 10 - 20 & 6 & 15 \\ 20 - 30 & 8 & 25 \\ 30 - 40 & 10 & 35 \\ 40 - 50 & 7 & 45 \\ \end{tabular}Solution:
Using the formula: \[ \text{Mean} = \frac{\sum x f}{\sum f}. \] \[ \text{Mean} = \frac{(5 \times 4) + (15 \times 6) + (25 \times 8) + (35 \times 10) + (45 \times 7)}{4 + 6 + 8 + 10 + 7}. \] \[ = \frac{20 + 90 + 200 + 350 + 315}{35}. \] \[ = \frac{975}{35} = 27.86. \] Thus, the mean is approximately \(27.86\).Example 3: Determine the median from the cumulative frequency curve (ogive) below.
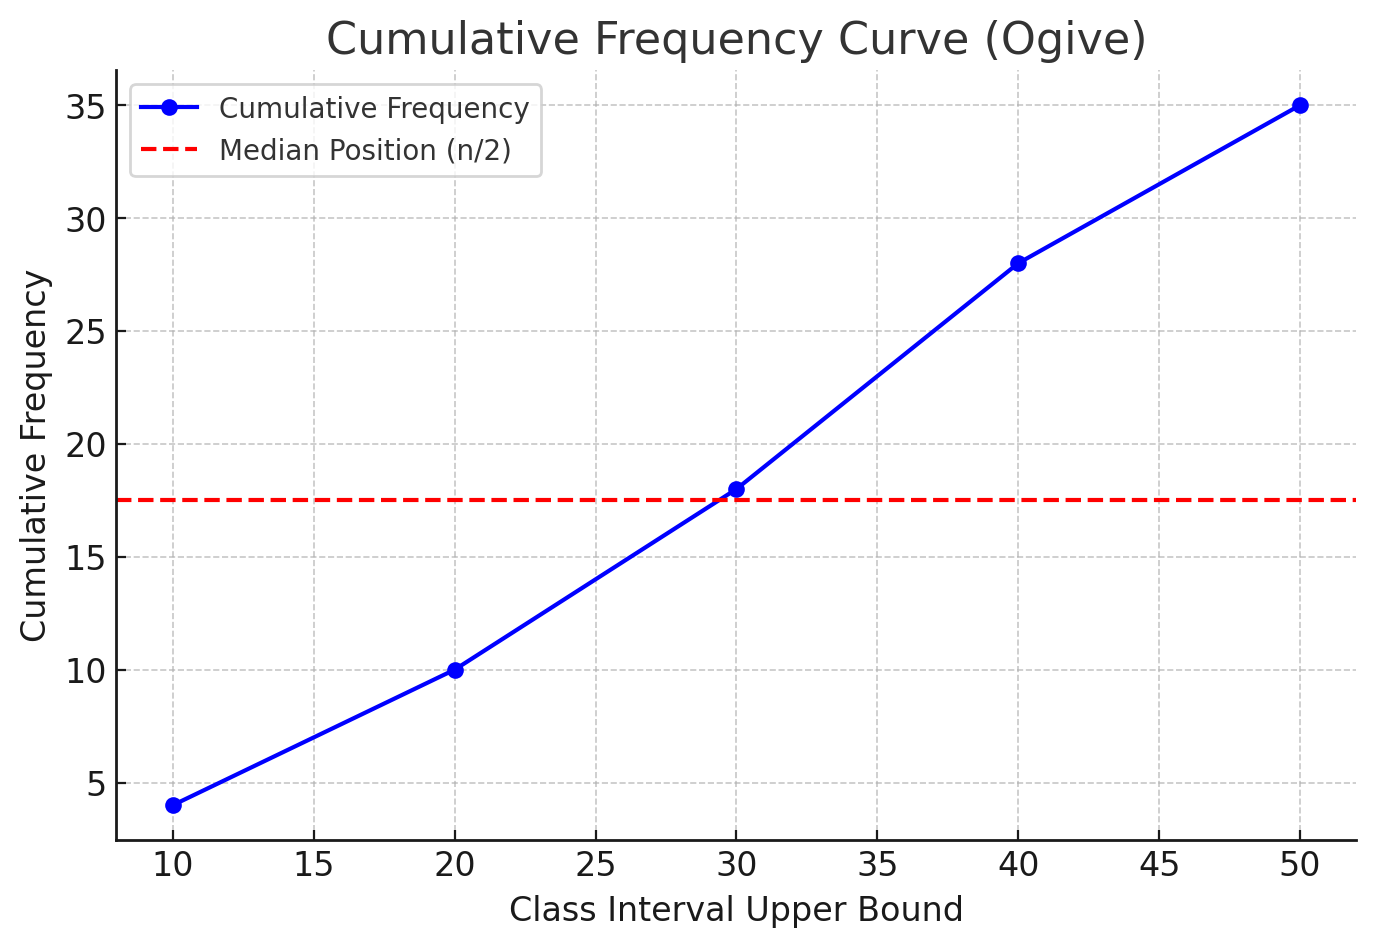
Solution:
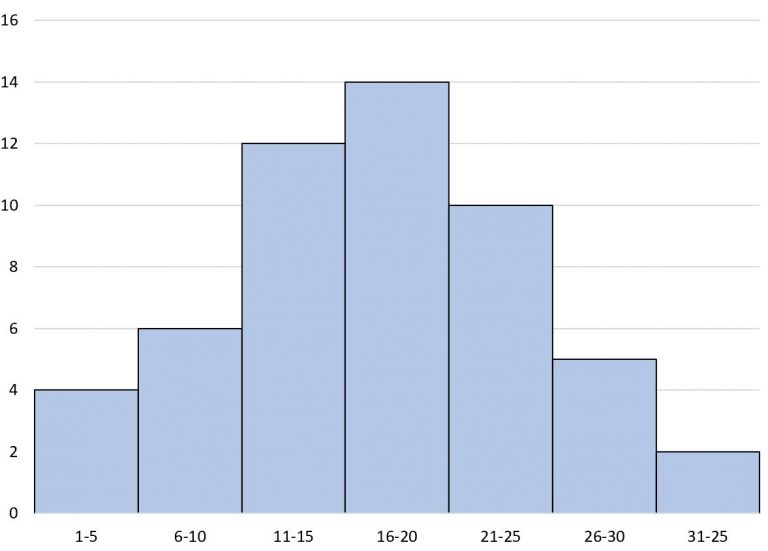
Step 1: Identify the total number of observations \(n\). Step 2: Find the median position: \(\frac{n}{2} = \frac{35}{2}=17.5\). Step 3: Locate the corresponding value on the cumulative frequency curve: dashed red line on the graph. Step 4: Use interpolation if necessary to estimate the median value. Solution is the intersection of cummulative frequency curve and dashed line. From the graph, the estimated median is around \(28\).Example 4: Determine the Mode from the Given Histogram.
Solution:
Step 1: Identify the modal class.- The modal class is the class interval with the highest frequency, which is \(16-20\).
- Draw two diagonal lines from the tops of the bars adjacent to the modal class, forming an "X" shape.
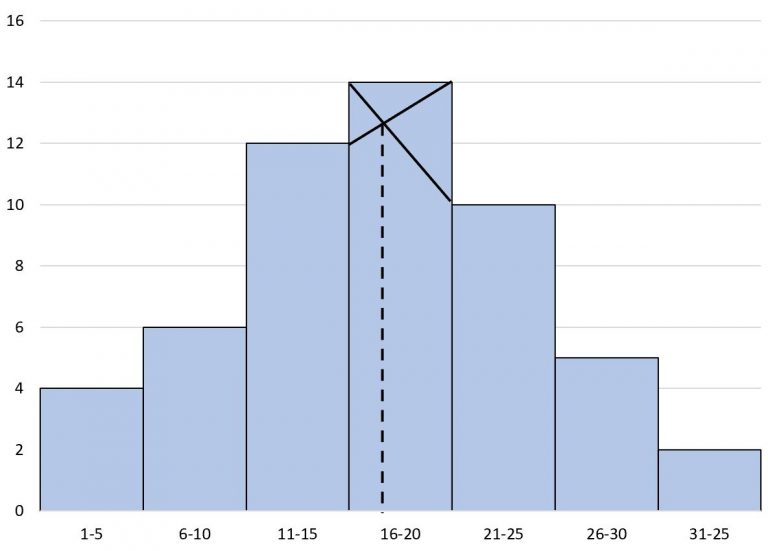
Histogram with Mode Estimation Using Line Intersection. - The intersection of these lines falls near \(x \approx 17\), which represents the estimated mode.
- From the visual estimation, the mode is approximately: \[ \textbf{Mode} \approx 17. \]