6.3 Probability Calculations from Various Graphs
Probability can be estimated from different types of graphical representations, including pie charts, histograms, cumulative frequency graphs, and Venn diagrams.Examples:
Example 1: Probability from a Pie Chart
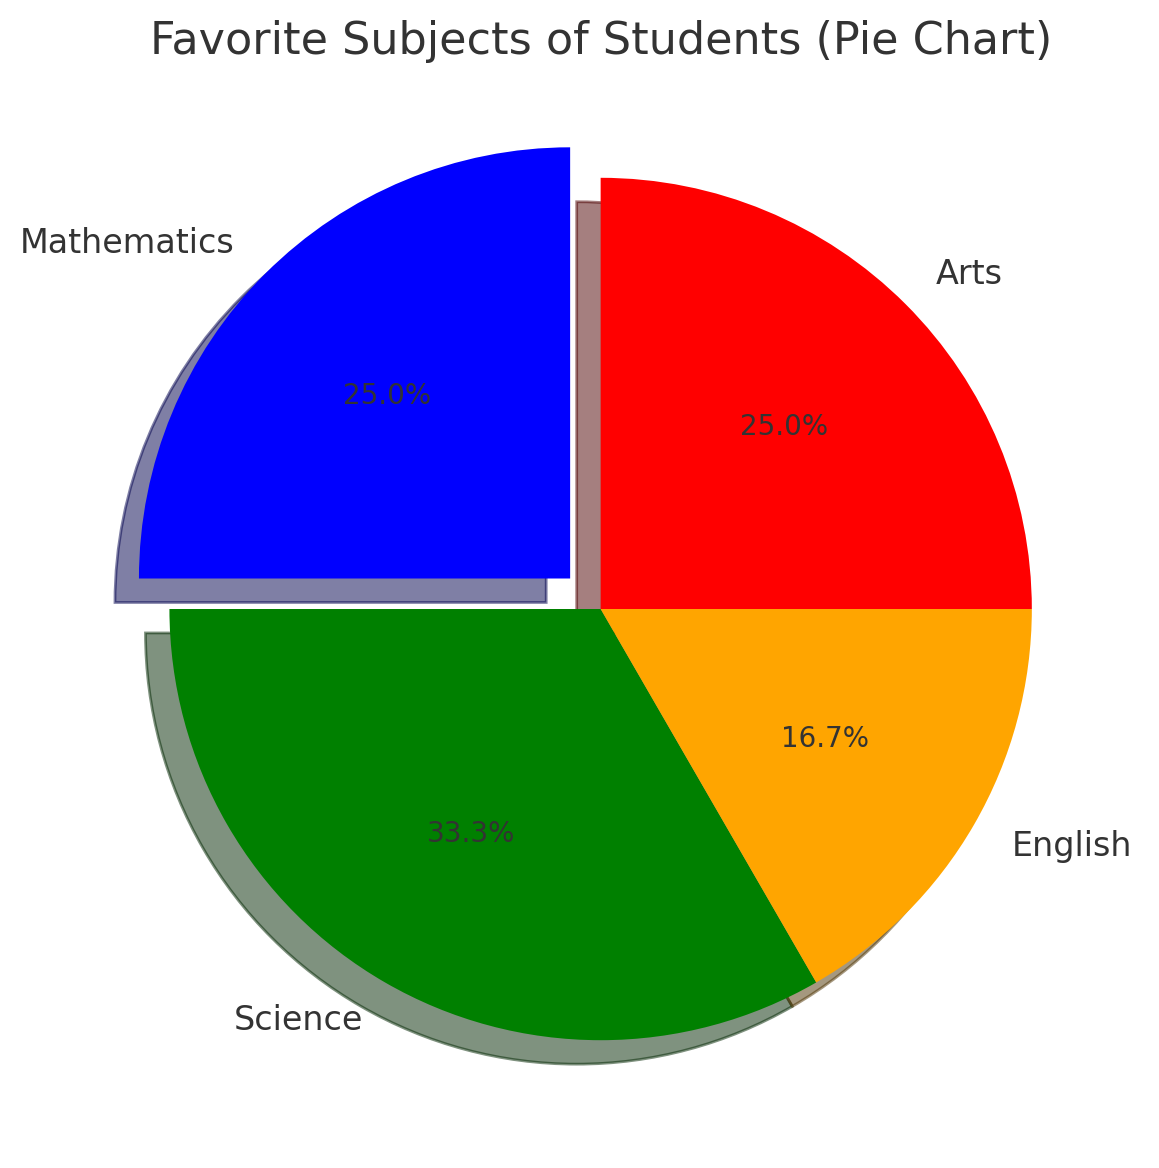
Solution:
Step 1: Compute the proportion of students who prefer Science. \[ \text{Fraction of Science} = \frac{120^\circ}{360^\circ} = \frac{1}{3}. \] Step 2: Compute probability. \[ P(\text{Science}) = \frac{1}{3} = 0.333. \] Thus, the probability that a randomly chosen student prefers Science is **\(0.333\) or \(33.3\%\)**.Example 2: Probability from a Histogram
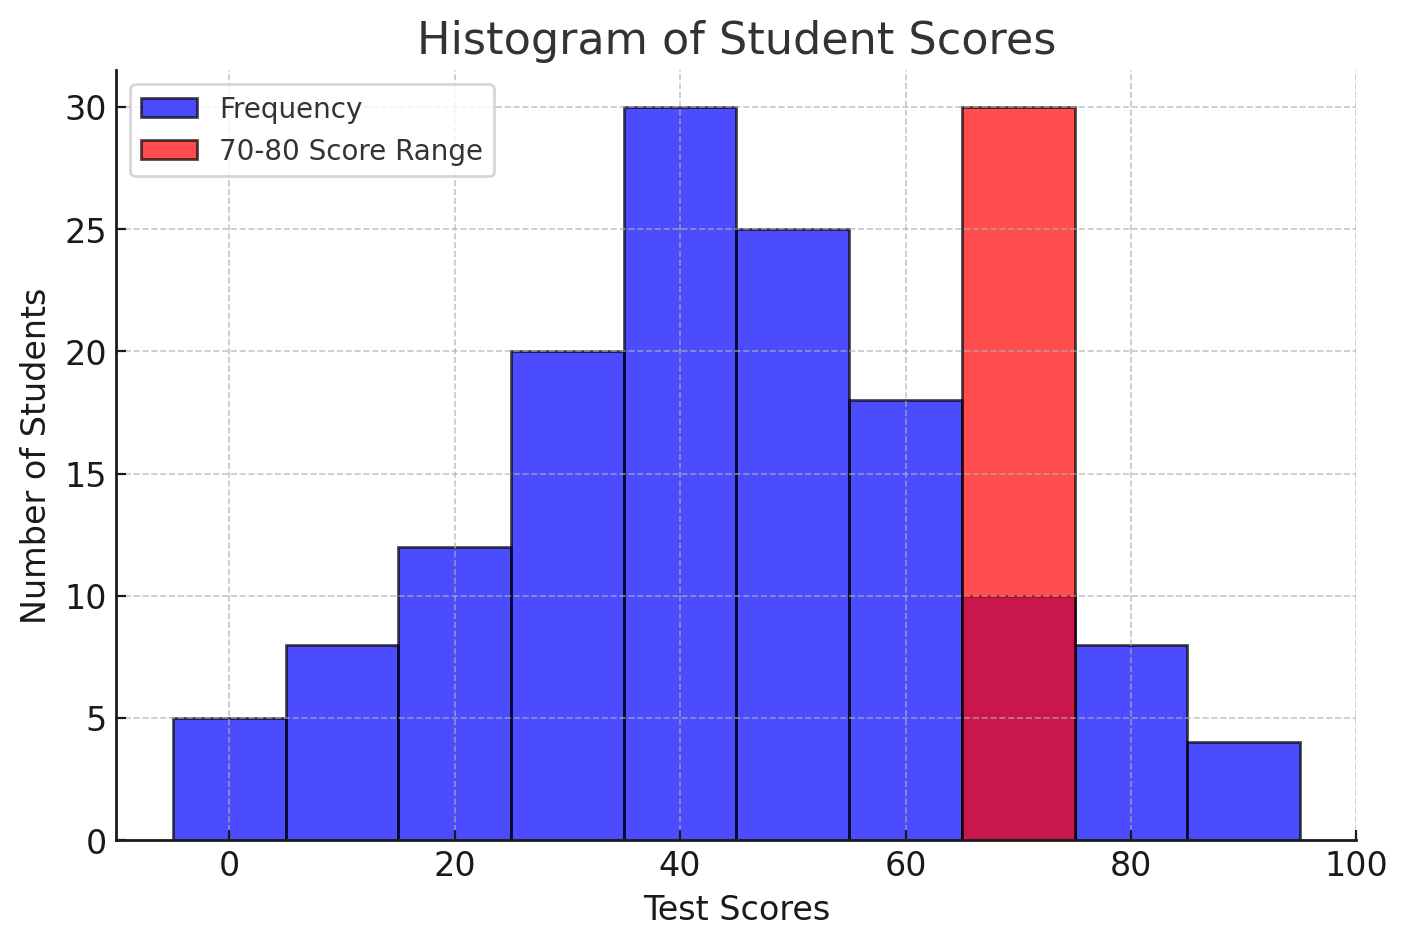
Solution:
Step 1: Use the probability formula. \[ P(70 \leq \text{Score} \leq 80) = \frac{\text{Number of students in range}}{\text{Total students}}. \] \[ = \frac{30}{100} = 0.30. \] Thus, the probability is **\(0.30\) or \(30\%\)**.Example 3: Probability from a Cumulative Frequency Curve
A cumulative frequency graph shows the number of students scoring below certain marks in a test. Find the probability for the student to get distinction for the test if distinction score is 90.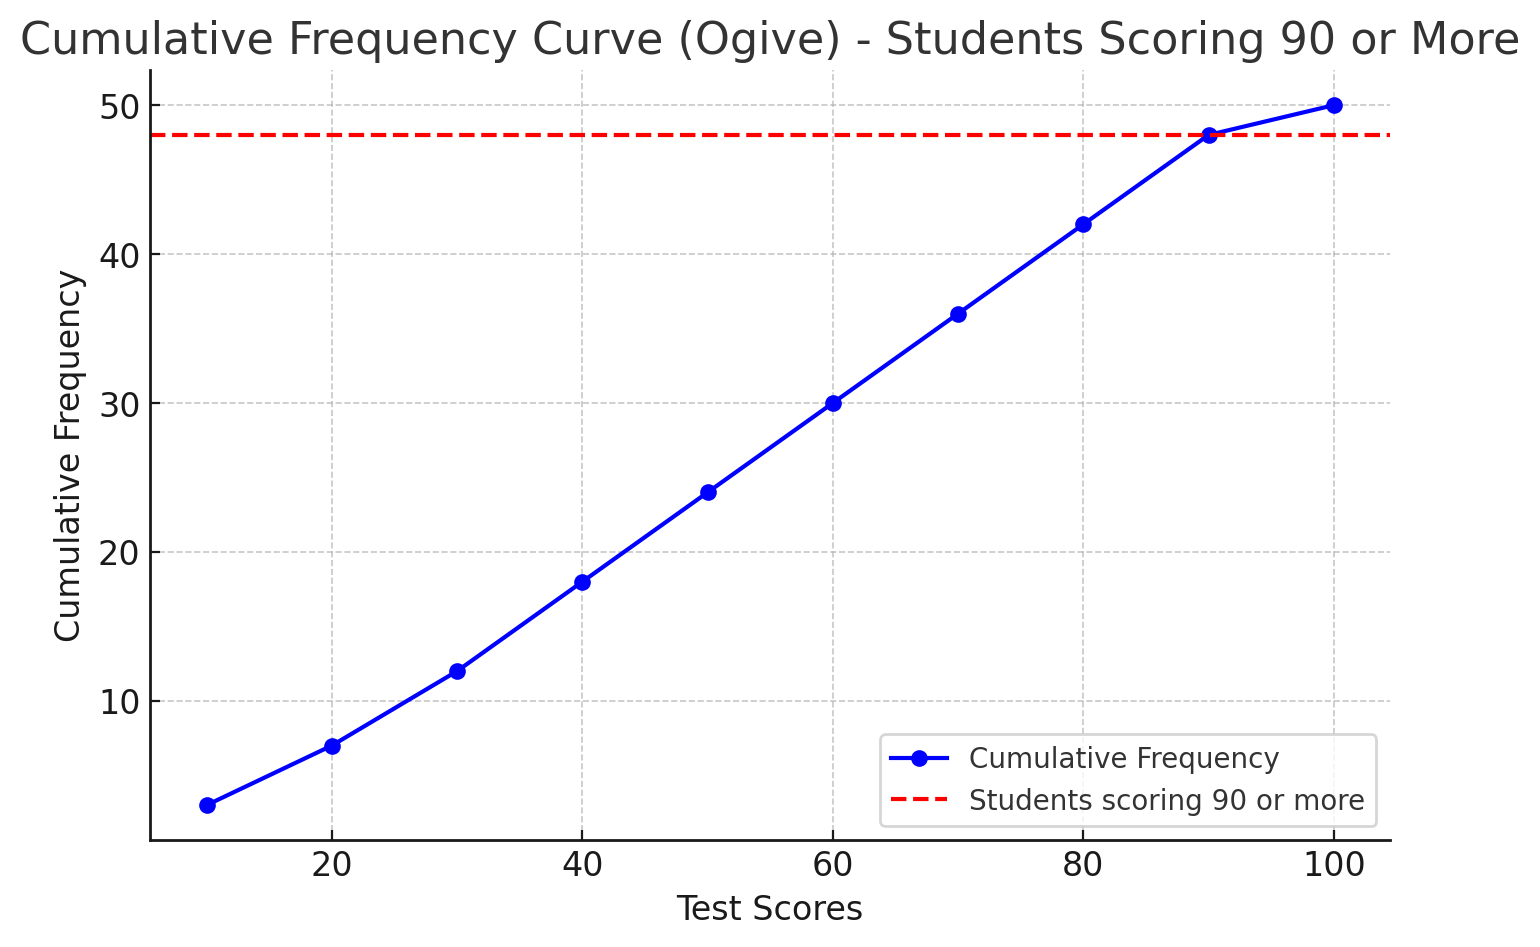
Solution:
Step 1: Compute probability. \[ P(distinction)=P(\text{Score} >90) = \frac{2}{50} = 0.04. \] Thus, the probability is **\(0.04\) or \(4\%\)**.Example 4: Probability from a Venn Diagram
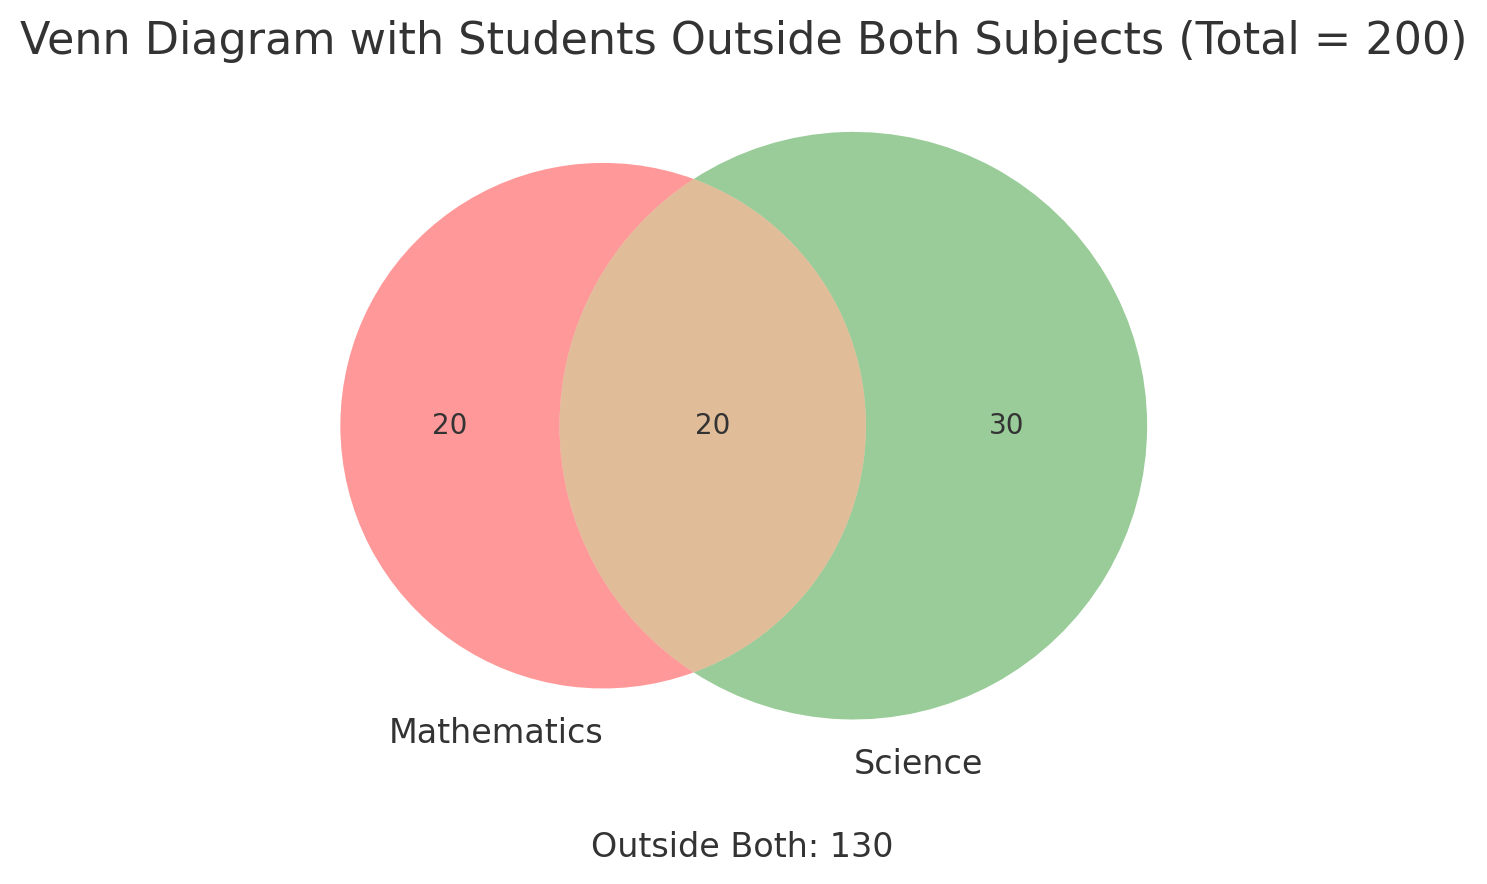
Part A Solution:
Step 1: Use the addition rule. \[ P(A \cup B) = P(A) + P(B) - P(A \cap B). \] \[ P(\text{Math or Science}) = \frac{40}{200} + \frac{50}{200} - \frac{20}{100}. \] \[ = \frac{70}{200} = 0.35. \] Thus, the probability is **\(0.35\) or \(35\%\)**.\\ \vspace{10pt}Part B Solution:
\[ P(\text{Math Only}) = \frac{20}{200}=0.1. \] Thus, the probability is **\(0.10\) or \(10\%\)**.